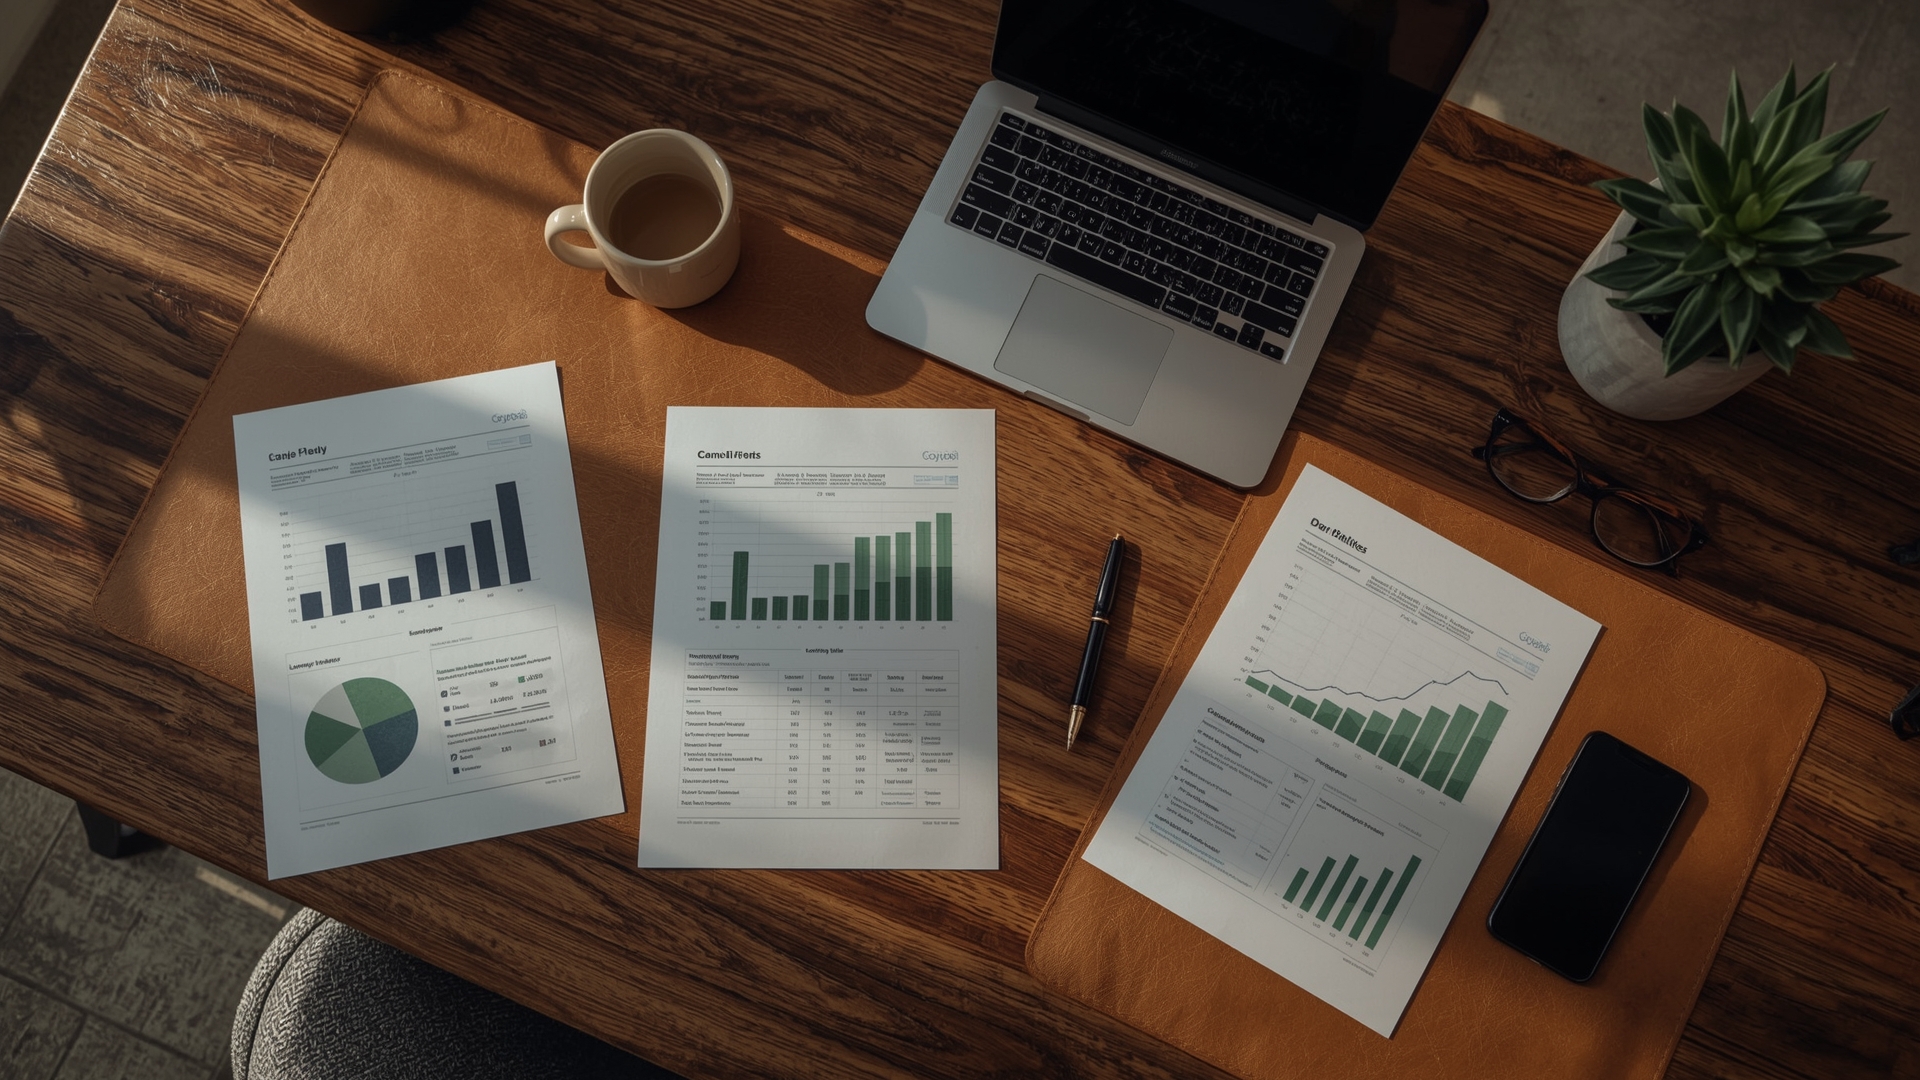
Most small business owners are great at running their business. Reading financial statements is a different skill entirely. Lenders, investors, and even tax professionals expect you to know these three documents cold: the profit and loss statement, the balance sheet, and the cash flow statement.
This guide breaks each one down in plain language. You’ll learn what each statement shows, why it matters to lenders, and how to read the numbers so you can make smarter decisions for your business.
Key Takeaways
- Three statements tell your whole financial story: The P&L shows profitability, the balance sheet shows what you own and owe, and the cash flow statement shows how money moves.
- Lenders require all three: Banks and SBA lenders review these documents together to assess your creditworthiness and repayment ability.
- Accrual vs. cash basis matters: Most lenders prefer accrual-based statements because they give a more accurate picture of business performance.
- Timing gaps can sink you: A profitable business can still run out of cash. The cash flow statement explains why.
- Consistency is critical: Lenders typically want two to three years of financial statements plus year-to-date figures.
- You don’t need a CPA to read these: Understanding the basics puts you in control of your business finances and your loan conversations.
What Are the Three Core Financial Statements Every Small Business Needs?

Quick Answer: The three core financial statements are the profit and loss statement (P&L), the balance sheet, and the cash flow statement. Together they show whether your business is profitable, financially stable, and generating real cash.
Think of these three documents as a health check for your business. Each one looks at your finances from a different angle.
The profit and loss statement (also called the income statement) shows revenue and expenses over a period of time. The balance sheet is a snapshot of what your business owns and owes on a specific date. The cash flow statement tracks the actual movement of cash in and out of your business.
No single statement tells the full story. A business can show a profit on paper but still struggle to pay its bills. That’s why lenders look at all three together.
Why Lenders Review All Three Statements Together
Lenders use these statements to answer one core question: can this business repay the loan? The P&L shows earning power. The balance sheet shows financial strength. The cash flow statement confirms whether cash actually exists to make payments.
A strong P&L paired with a weak balance sheet raises red flags. A healthy balance sheet with poor cash flow does the same. Lenders want to see all three moving in the right direction before they approve financing.
What Does a Profit and Loss Statement Show?
Quick Answer: A profit and loss statement shows your total revenue, cost of goods sold, operating expenses, and net profit or loss over a specific period, usually monthly, quarterly, or annually. It tells you whether your business is making money.
The P&L is usually the first financial statement lenders and accountants ask to see. It’s structured in a simple top-to-bottom format that starts with revenue and works down to the bottom line.
How to Read a Profit and Loss Statement
Start at the top with gross revenue. This is your total sales before any deductions. Below that, you subtract the cost of goods sold (COGS), which covers direct costs like materials, production, and labor tied to making your product or delivering your service.
The result is your gross profit. Then you subtract operating expenses, which include rent, utilities, payroll, marketing, and administrative costs. What’s left is your operating income. After interest and taxes, you reach net income, also called the bottom line.
P&L Statement: Key Line Items and What They Mean
| Line Item | What It Represents | Lender Focus |
|---|---|---|
| Gross Revenue | Total sales before any deductions | Business size and growth trend |
| Cost of Goods Sold (COGS) | Direct costs tied to production or service delivery | Gross margin efficiency |
| Gross Profit | Revenue minus COGS | Core profitability before overhead |
| Operating Expenses | Overhead costs: rent, salaries, utilities, marketing | Cost structure and control |
| Operating Income (EBIT) | Profit before interest and taxes | Operational earning power |
| Net Income | Final profit after all expenses, interest, and taxes | Bottom-line health and repayment capacity |
What Is a Good Gross Margin for a Small Business?
Gross margin varies widely by industry. A retail business might run 25% to 50% gross margin. A service business often sees 60% to 80%. Software companies can reach 70% to 90%. The key isn’t hitting a universal number. It’s staying competitive within your industry and trending upward over time.
Lenders compare your gross margin against industry benchmarks. A margin well below your industry average signals a pricing problem, a cost control problem, or both.
What Is a Balance Sheet and How Do You Read One?
Quick Answer: A balance sheet is a financial snapshot showing your business assets, liabilities, and owner’s equity on a specific date. The core formula is: Assets = Liabilities + Owner’s Equity. It shows whether your business is financially solvent.
The balance sheet gets its name from the fact that both sides must always be equal. If they don’t balance, there’s an error somewhere in your books.
It’s divided into three sections: assets on one side, and liabilities plus owner’s equity on the other. Assets are things your business owns or is owed. Liabilities are what you owe to others. Owner’s equity is what’s left for you after all debts are paid.
Current vs. Long-Term Assets and Liabilities
Assets are split into current assets and long-term assets. Current assets are things you can convert to cash within 12 months, like cash on hand, accounts receivable (money customers owe you), and inventory. Long-term assets include equipment, vehicles, real estate, and intellectual property.
Liabilities follow the same split. Current liabilities are debts due within 12 months, like accounts payable and short-term loans. Long-term liabilities include mortgages, equipment loans, and SBA loans.
Balance Sheet: Entity, Attribute, and Value Table
| Entity | Category | Typical Value Range (Small Business) | Lender Significance |
|---|---|---|---|
| Cash and Cash Equivalents | Current Asset | 1-3 months of operating expenses | Liquidity and short-term solvency |
| Accounts Receivable | Current Asset | Varies by industry; <60 days preferred | Collection efficiency |
| Inventory | Current Asset | 30-90 days of COGS in product businesses | Liquidity risk if unsold |
| Equipment and Machinery | Long-Term Asset | Net book value after depreciation | Collateral potential |
| Accounts Payable | Current Liability | Vendor invoices due within 30-60 days | Short-term cash obligations |
| Long-Term Debt | Long-Term Liability | Outstanding loan balances | Total debt burden |
| Owner’s Equity | Equity | Positive equity preferred; ratio >1.0 | Financial cushion and risk buffer |
What Is the Debt-to-Equity Ratio and Why Does It Matter?
The debt-to-equity ratio compares your total liabilities to your owner’s equity. It measures how much of your business is financed by debt versus your own investment. A ratio below 2.0 is generally considered healthy for most small businesses. A ratio above 4.0 can make lenders nervous.
High debt relative to equity means more risk. If the business struggles, there’s less cushion to absorb losses. Lenders use this ratio to gauge how much additional debt your business can reasonably carry.
What Is a Cash Flow Statement and Why Is It Different From a P&L?

Quick Answer: A cash flow statement tracks actual cash moving in and out of your business across three activities: operations, investing, and financing. Unlike the P&L, it only counts cash that has actually moved, not revenue you’ve earned but not yet collected.
This is the statement most business owners overlook. It’s also the one that explains why a profitable business can still run out of money.
The difference comes down to timing. Say you invoice a client for $20,000 in March. Your P&L records that as March revenue. But if the client pays in May, your March cash flow shows zero from that sale. The cash flow statement captures that gap.
The Three Sections of a Cash Flow Statement
Operating activities cover the cash generated or used by your core business operations. This includes cash collected from customers, payments to suppliers, and payroll. It’s the most important section for lenders.
Investing activities show cash used to buy or sell long-term assets like equipment or property. Financing activities cover cash from loans, owner contributions, or loan repayments. A business can have negative investing cash flow (buying equipment) and still be financially healthy.
Cash Flow Statement: Three Sections Compared
| Section | What It Tracks | Positive Signal | Warning Sign |
|---|---|---|---|
| Operating Activities | Cash from core business operations | Consistent positive cash flow from operations | Negative operating cash flow despite reported profit |
| Investing Activities | Cash from buying or selling long-term assets | Controlled investment in growth assets | Excessive asset purchases without revenue growth |
| Financing Activities | Cash from loans, equity, or debt repayment | Debt repayment with operating cash | Relying on new loans to cover operating shortfalls |
Why Lenders Care More About Operating Cash Flow Than Net Income
Net income can be influenced by non-cash items like depreciation or amortization. Operating cash flow strips those out and shows the actual cash your business generates. Lenders use operating cash flow to calculate your debt service coverage ratio (DSCR), which measures whether you have enough cash to make loan payments.
Most lenders require a DSCR of at least 1.25. That means for every $1.00 in debt payments, your business generates $1.25 in operating cash flow. Below 1.0 means you can’t cover your payments from operations alone.
What Is the Difference Between Cash Basis and Accrual Accounting?
Quick Answer: Cash basis accounting records revenue and expenses when cash actually changes hands. Accrual accounting records them when they are earned or incurred, regardless of payment timing. Most lenders prefer accrual-based financial statements for loan reviews.
Many small businesses start on cash basis accounting because it’s simpler. You record income when you get paid. You record an expense when you pay it. That’s straightforward for a small operation.
Accrual accounting is more complex but more accurate. It matches revenue to the period it was earned and expenses to the period they were incurred. This gives a clearer picture of your business’s true performance over time.
Cash Basis vs. Accrual: Key Differences
| Factor | Cash Basis | Accrual Basis |
|---|---|---|
| Revenue Recognition | When cash is received | When revenue is earned |
| Expense Recognition | When cash is paid | When expense is incurred |
| Complexity | Low; easy to maintain | Higher; requires tracking receivables and payables |
| Lender Preference | Accepted for very small businesses | Preferred for loan review and SBA applications |
| IRS Requirement | Required if revenue is under $27M (most small businesses) | Required for inventory-heavy businesses over $27M |
| GAAP Compliant | No | Yes |
How Many Years of Financial Statements Do Lenders Require?
Quick Answer: Most lenders require two to three years of business tax returns and financial statements, plus a year-to-date profit and loss statement. SBA lenders typically request three years of business and personal tax returns alongside all three financial statements.
The more history you have, the more confidence a lender has in your numbers. A single strong year could be an anomaly. Three consistent years tells a much more credible story.
If your business is newer, lenders may substitute financial projections alongside whatever actual statements you have. They’ll weigh your industry experience, your personal credit, and your business plan more heavily when historical data is limited.
What Year-to-Date Financials Should Include
Your year-to-date (YTD) profit and loss statement should cover every month from January 1 of the current year through the most recent full month. If you’re applying for a loan in April, your YTD P&L should run through March 31.
Lenders compare your YTD figures against the same period in prior years. They’re looking for growth, consistency, or a reasonable explanation for any decline.
How Do You Prepare Financial Statements If You Don’t Have a CPA?
Quick Answer: You can prepare basic financial statements using accounting software like QuickBooks, Wave, or FreshBooks. These tools generate P&L statements, balance sheets, and cash flow reports automatically from your transaction data.
You don’t need a CPA to produce your own financial statements. But you do need clean, consistent bookkeeping. If your transactions are categorized correctly, modern accounting software does most of the heavy lifting.
Common Bookkeeping Mistakes That Skew Financial Statements
- Mixing personal and business expenses: Any personal transaction in your business account distorts your P&L and can trigger lender scrutiny.
- Miscategorizing COGS vs. operating expenses: Putting direct production costs in the wrong place inflates or deflates your gross margin.
- Skipping depreciation entries: Forgetting to record asset depreciation overstates both your net income and your asset values on the balance sheet.
- Ignoring accounts receivable aging: Old uncollected invoices left on the books make your current assets look stronger than they actually are.
- Cash basis inconsistency: Switching between cash and accrual methods mid-year produces financial statements that can’t be compared year to year.
When Should You Hire a CPA to Prepare Your Statements?
For loan amounts above $100,000, most lenders prefer CPA-prepared or CPA-reviewed financial statements. An SBA loan typically requires CPA-prepared statements for any business with revenue above $1 million or complex financial structures.
A CPA-prepared statement carries more credibility with lenders because it includes a formal opinion on whether the statements fairly represent your financial position. The cost ranges from $500 to $3,000 per year depending on your business complexity and region.
How Do Lenders Use Financial Statements to Evaluate a Loan?

Quick Answer: Lenders analyze your financial statements to calculate key ratios including DSCR, debt-to-equity, current ratio, and gross margin. These ratios tell them whether your business generates enough cash to repay debt and whether your financial position is stable enough to take on more.
When a lender reviews your application, they’re building a financial profile of your business. The statements are the raw data. The ratios are the analysis.
Key Financial Ratios Calculated From Your Statements
| Ratio | Formula | Healthy Benchmark | Source Statement |
|---|---|---|---|
| Debt Service Coverage Ratio (DSCR) | Net Operating Income ÷ Total Debt Service | 1.25 or higher | P&L + Cash Flow |
| Current Ratio | Current Assets ÷ Current Liabilities | 1.5 to 2.0 | Balance Sheet |
| Debt-to-Equity Ratio | Total Liabilities ÷ Owner’s Equity | Below 2.0 | Balance Sheet |
| Gross Margin | (Revenue − COGS) ÷ Revenue × 100 | Varies by industry; above sector average | P&L |
| Net Profit Margin | Net Income ÷ Revenue × 100 | 5% to 20% depending on industry | P&L |
What Happens If Your Financial Statements Show a Loss?
Showing a loss doesn’t automatically disqualify you from a loan. Lenders look at the reason for the loss. A one-time capital expense, a COVID recovery year, or a planned expansion investment tells a different story than consistent operating losses.
You should be prepared to explain any loss clearly. A written explanation with supporting documentation goes a long way. Lenders respond better to owners who understand their own financials than to those who seem surprised by their own numbers.
What Is Owner’s Compensation and How Does It Affect Your Financial Statements?
Quick Answer: Owner’s compensation, also called owner’s draw or officer salary, appears as an expense on your P&L and reduces net income. Lenders often add it back when calculating your business’s true earning power, a process called add-back analysis.
Many small business owners pay themselves through owner draws or officer salaries. Both flow through the financial statements differently depending on your business structure.
In a sole proprietorship or partnership, owner draws don’t appear as a P&L expense. The net income itself is your income. In an S-corporation or C-corporation, officer salaries are business expenses that reduce net income on the P&L.
How Lenders Handle Add-Backs
Lenders often adjust your reported net income using add-backs. They add back items like depreciation, amortization, one-time losses, and excessive owner compensation to calculate a more accurate picture of your business cash flow.
This adjusted figure is called seller’s discretionary earnings (SDE) in business valuations, or adjusted EBITDA (earnings before interest, taxes, depreciation, and amortization) in lending contexts. It gives lenders a cleaner view of what the business actually generates before personal and non-cash items are removed.
Frequently Asked Questions
Do I need all three financial statements to apply for a small business loan?
Yes, in most cases. Banks and SBA lenders require the profit and loss statement, balance sheet, and cash flow statement. Some alternative lenders may only request a P&L and bank statements, but traditional lenders and SBA programs expect all three.
Can I use my business tax return instead of a formal P&L statement?
Your business tax return (Schedule C, Form 1120-S, or Form 1065) can substitute for a formal P&L in some cases. However, lenders typically want both. The tax return shows what was reported to the IRS. A separately prepared P&L can show year-to-date performance the tax return doesn’t capture.
What is owner’s equity and how is it calculated?
Owner’s equity is the value left in your business after subtracting all liabilities from all assets. The formula is: Owner’s Equity = Total Assets − Total Liabilities. Positive and growing equity signals a financially strengthening business.
What does it mean if my cash flow from operations is negative?
Negative operating cash flow means your core business operations are consuming more cash than they generate. This is a serious warning sign, even if your P&L shows a profit. It often points to slow-paying customers, rapid inventory buildup, or unsustainable operating costs.
How often should a small business prepare financial statements?
At minimum, you should prepare financial statements monthly. Monthly statements let you catch problems early, track trends, and stay ready for loan applications. Many accounting software platforms generate these automatically if your books are up to date.
What is EBITDA and do lenders use it for small business loans?
EBITDA stands for earnings before interest, taxes, depreciation, and amortization. It measures your business’s core operating profitability by removing non-cash and financing items. Lenders use it alongside DSCR to assess your repayment capacity, especially for larger loan amounts above $250,000.